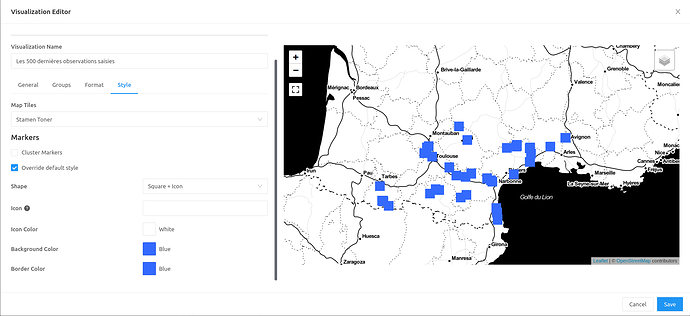
In order to enhance map visualization, would it be possible to set the size of shapes (at least squares) used to show point data ?
This would be a great and easy way to visualize and generate regular grid maps. We should just need to get centroïd’s coordinates in our query to show such a grid.
The best unit would be a meter size but DMS should work too.

