When I draw a line chart,all the empty values are filled with zeros. This does not make sense for my case. In a lot of timeseries analysis case, some series are suppose to be shorter than the others. Empyt values at the end of the line are suppose to be empty. It’s better to allow user to control the behaviour of filling of missing values.
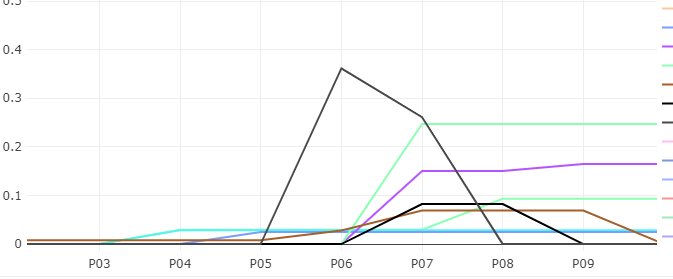
Like in the ubove picture, the gray line should stop at P07, the black line shoud stop at P08, the brown line should stop at P09. I dont want the empty values to be filled. How to achieve this ?