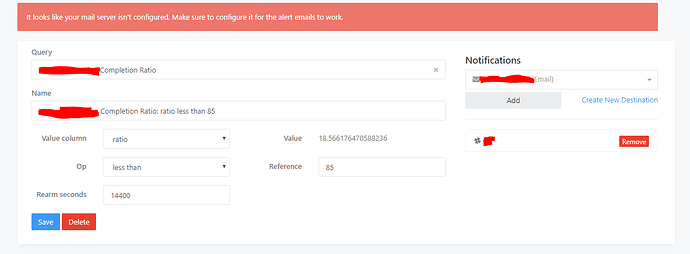
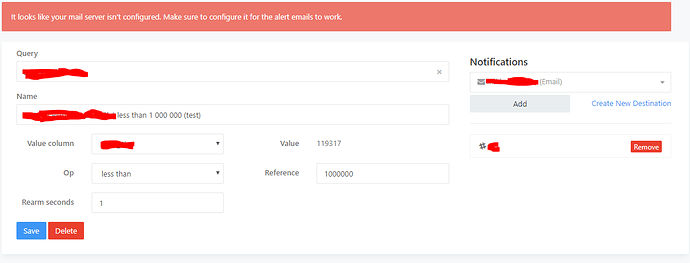
We’re trying to implement alerting system for our graphs, but we are having difficulty with alerts not triggering properly. Our demo’s in the pictures are almost the same, but one triggers and one does not. We haven’t been able to find a reason for this behaviour no matter what changes we make.
For clarity: do both of these queries run on the same schedule?
I also notice your examples use different rearm seconds. That would change the alert behavior.
I have manually ran both queries multiple times with different configurations and both have had 5 and 60 second rearm times, nothing has worked.
This isn’t clear.
Do you mean that one alert had a 5 second rearm while the other had 60? Or do you mean that both had the same value and you switched them between 5 and 60?
[Edit]: How do you know the alerts aren’t triggering? What does their status show on the main alerts page?
As in we tried both with both 5 and 60 rearm. You can see the statuses in the last picture I posted. We also have Slack alerts configured which we have tested to be working, but only completion ratio sent alert when it got to triggered, less than is always unknown
Sorry I missed that last screenshot. The status UNKNOWN is curious:
From our documentation:
UNKNOWNmeans Redash does not have enough data to evaluate the alert criteria. You should see this status immediately after creating your Alert until the query has executed. The Alert will also show this status if there was no data in the query result or if the most recent query result doesn’t have the configured Value Column .
Your screenshots shows the query last executed sixteen hours ago wile the other was more recent than that. Are you sure the “Less Than” query is executing like you expect?
Yes I’m completely sure. It’s a query we use every day.
Alright. So we know why the alert does not trigger: it doesn’t “see” the query execution so it never evaluates the alert criteria. That’s what UNKNOWN means.
The simplest explanation here is that your alert tracks a different query than you think. You can test this.
- Fork the “less than” query.
- Name the fork something unique.
- Delete the current alert and make a new one pointed at your uniquely named query.
When you run the new query, does the alert fire?
If this doesn’t work then you will need to search the logs for a deeper cause. Typical log messages around alerting look like this: Checking ${query_id} for alerts
I ended up here, the issue lies within the query. Your query needs to have a refresh schedule. So go to your saved query and adjust this on the bottom left. Eg refresh every 10 minutes, never ending schedule. Hope this helps


