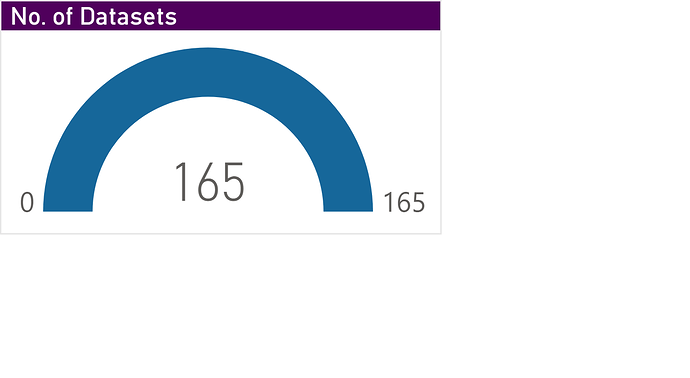
Is there any way to create a chart like this just to display the count in a more presentable way rather than a normal table?
This site is in read only mode. Please continue to browse, but replying, likes,
and other actions are disabled for now.
Redash includes the counter visualisation type, which you can select in the visualisation editor.
Example here: https://redash.io/help/user-guide/visualizations/visualization-types#Counter

