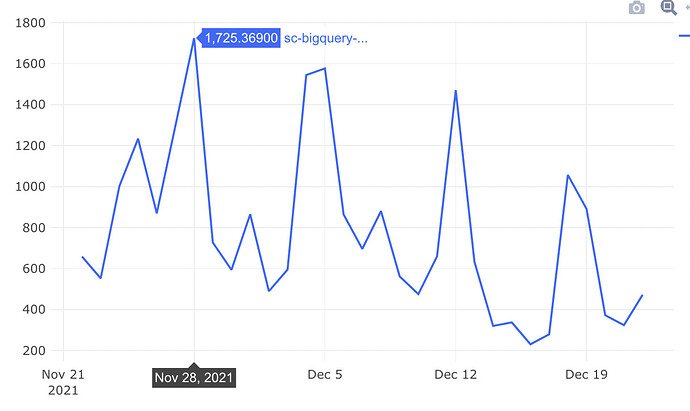
I am currently creating a visualization which has X axis as a date.
The visualization displays the date as - Dec 9, 2021 (image below)
I wanted to change this to a different format which would include the day as well, something like - Mon, 9th Dec 2021 (it’s OK if the date gets lost!)
Is there a way to do this? I did set the date field (X axis) as datetime, and tried playing around with Data Labels > Date/Time Values Format , but nothing seems to change the format.
Any help would be appreciated!


