Hi there !
I’m creating a dashboard and I have some issues with one chart.
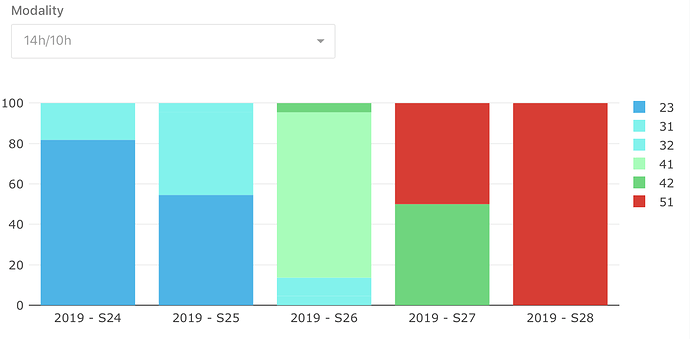
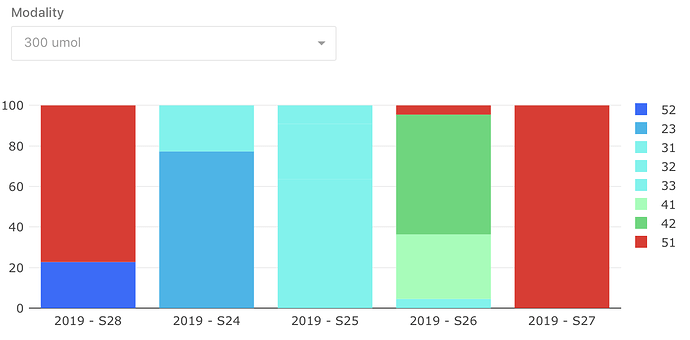
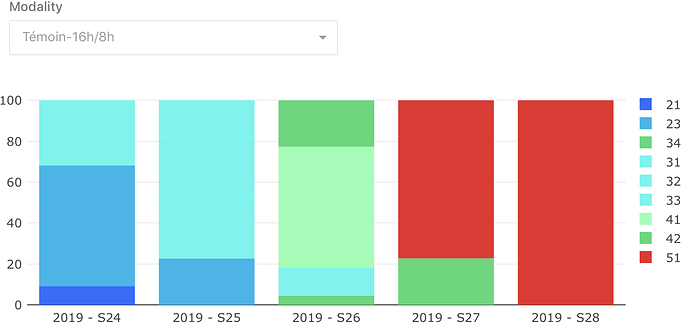
For this chart I have created a dropdown to choose a modality and see the corresponding data . I have ordered my series and added a colour to each category but the thing is that when I change the modality, the new chart doesn’t have the updates I previously put…
For exemple, the “order” of my values is not the same, the colours change, and even the X axis is not chronological anymore (but all of this comes from the same unique query…)
Here’s some screenshots to show you my issues
Thanks a lot for your help 
For sorting problem, you need to go to Edit Visualizations, go to x axis and toggle the “sort values” to ON. If it’s still not correct, change the scale (kind of forget what it was, CMIIW) from automatic/linear/datetime to Category.
For the color problem, you need to always outputting all of the values from your column grouping. So Redash will remember what color for value 22 or 23 every time you changed the query parameter. If it’s outputting 0 values change it to NULL so it didn’t appearing in your chart. Hope it helps!
Thanks a lot for you answer !
The “sort values” was already ON but I changed the scale to Category and it fixed my problem ! 
For the color problem the thing is that I cannot output all of the values every time because it takes values from the data base and according to the modalities all the values do not always exist… Like for example there is no “21” for the modality “14h/10h” and no “34” for the modality “300 umol”… 
Do you have any idea to help me with that ?
Glad it works! Happy to help.
Here’s the actual workaround from another post: Assign colours permanently for temporarily occurring series
You could write a subquery that will outputting all possible value for every modalities filter. Then LEFT JOIN to your actual query, so that every X column has every possible grouping column.
Of course it will be very big result if you have a lot of distinct values in your grouping column. But then again, if you have a lot of distinct values, maybe you could switch to pivot table 
Ok thanks a lots for your help ! It helped me with all my issues 
![]()


