I find it a pity that the Choropleth map feature in Redash only allows us to mark countries. It’s not possible to show the differences for smaller areas but our customers mainly come from only one country.
This site is in read only mode. Please continue to browse, but replying, likes,
and other actions are disabled for now.
Yes, the choropleth needs some improvement. We’d like to make it easier for the community to contribute visualizations. This will be easier once the React migration is complete.
4 Likes
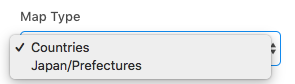
There’s already support in the Coropleth map viz for multiple types:
I may very well consider submitting a PR for adding USA/States and USA/Counties as built-in options. ![]() @jesse does that sound like a likely-mergeable PR, or is this frozen by the React migration?
@jesse does that sound like a likely-mergeable PR, or is this frozen by the React migration?
1 Like
Very soon I’ll start working on migrating Choropleth visualization to React, and by the way I plan to implement a feature that will allow to use arbitrary GeoJSON (loaded from external source) in visualization. I think it will cover all cases like this one.
4 Likes
Found this thread and wanted to say this one would be really important for us. We need to create visualizations of signup counts per NUTS1/NUTS2/NUTS3 of a variety of European countries and our current data is visualized with Redash so we’re wondering how to achieve that now 
We already have on open PR for this feature (https://github.com/getredash/redash/pull/4599). You can subscribe for updates to know when it becomes available.
1 Like