Hi!
I’ve been playing around with the cohort plots, but I can’t seem to get:
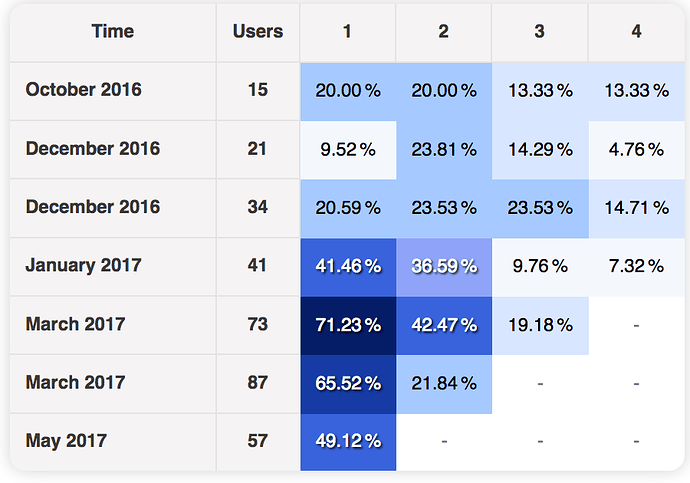
a) the dates to display correctly in the “Time” column of the cohort plot
b) The cohort plot to go far enough into the future, am I wrong in thinking the matrix should be square? I.E. if there are 10 months in the time column, there should be 10 columns labeled 1,2,3,…10?
Here is the cohort plot I get out:
And here’s the data that feeds it
What am I doing wrong?

