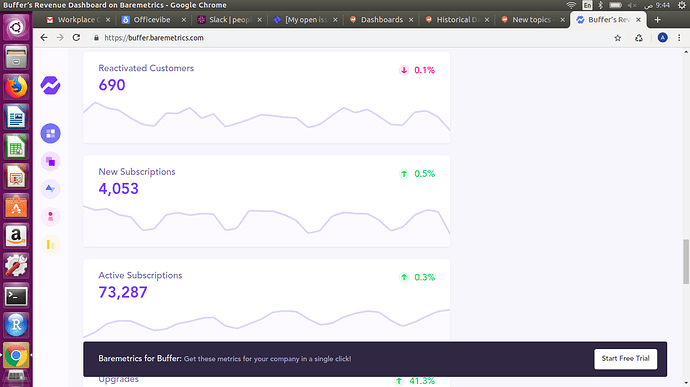
i need to make comparison between last month and current month data and know is there is up or down is redash support that
what i need to do is something like that @jesse @arikfr
This site is in read only mode. Please continue to browse, but replying, likes,
and other actions are disabled for now.
You have some options depending on your data source. It’s oracle, right?
- Select
month,last_month_metricandthis_month_metricin three columns. Chart bothmetriccolumns together. - Select
monthandsum(metric)and group bymonth. Then use a counter visualization to show progress. Here’s a video that shows this in more depth: - If your data source doesn’t support option 1, use the Query Results Data Source to join multiple queries and graph them together.

