Hi… im wondering if the bar chart in Redash is able to create line segment (Q1, Q2, Q3, Q4) like this picture…
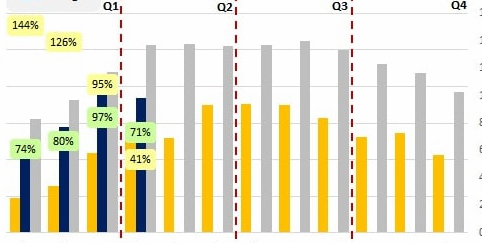
is it possible ? do i need to edit the code first ? and where to edit it ?
Hi… im wondering if the bar chart in Redash is able to create line segment (Q1, Q2, Q3, Q4) like this picture…
is it possible ? do i need to edit the code first ? and where to edit it ?
This isn’t supported by default.
It may be possible using a custom JS visualisation (without modifications to the source code). Although there have been some issues with custom JS visulasations recently so perhaps not.
If this is something you want to implement yourself, you would need to modify the Chart visualisation contained in viz-lib.