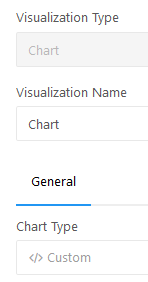
I’m trying to make a plotly map with the chart visualisation type with the custom chart type:
billede
It works fine with line charts, but I can’t get it to work with maps. Is that not supported? My code is taken directly from plotly.com:

var data = [{
  type:'scattermapbox',
  lat:['45.5017'],
  lon:['-73.5673'],
  mode:'markers',
  marker: {
    size:14
      },
  text:['Montreal']
}]

var layout = {
  autosize: true,
  hovermode:'closest',
  mapbox: {
    bearing:0,
    center: {
      lat:45,
      lon:-73
    },
    pitch:0,
    zoom:5
  },
}

Plotly.setPlotConfig({
  mapboxAccessToken: "my.secret.token"
})

Plotly.newPlot(element, data, layout)

Were you able to find a solution?

I’m trying the same for a choropleth map and I could not make it work :frowning:

var data = [{
  type: "choroplethmapbox", locations: ["NY", "MA", "VT"], z: [-50, -10, -20],
  geojson: "https://raw.githubusercontent.com/python-visualization/folium/master/examples/data/us-states.json"
}];

var layout = {mapbox: {center: {lon: -74, lat: 43}, zoom: 3.5},
          width: 600, height:400};

var config = {mapboxAccessToken: "ddddd"};

Plotly.newPlot(element, data, layout, config);