I’ve been using Custom JS charts for some of my visualisations, the line and bar ones worked fine, however I found some financial ones like waterfall, indicator (not working) didn’t work as intended or just didn’t work.

Also it seems that redash doesn’t support subplots?

Graphing codes were copied here:

I suspected it was because the plotly lib wasn’t the latest version in redash, thus it didn’t support those charts. What could be the reasons?

If it hasn’t updated to the latest version, is there anyway I can update the lib to its latest one?

Thanks

Without any specific information I’m not sure the community can help much here. You can try updating to a newer plotly though :pray:

Thanks for your response and apologise for the lack of info.

So basically I was just copying the code in plotly into the Custom Chart option in redash (to experiment the Custom Chart option). Most of the charts worked fine except those from the finance section (like the two attached above for example). Thus, I was thinking because the current version of plotly used by redash doesn’t support those charts and needs updating.

Any idea why this happened?

Could be. What happens when you try updating to a newer plotly? Do you see any errors in your console when the charts don’t render?

I haven’t updated the lib since I wasn’t sure how. Could you show me please?

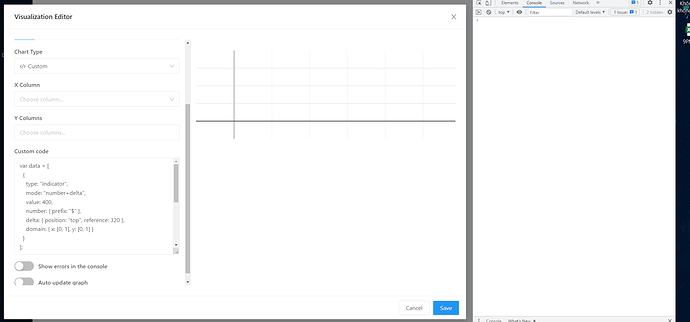
For the current version though, there was no error show. The chart’s grid still showed except the chart itself.

Can you check your browser console for javascript errors?

The plotly version is specified by the package.json file in the viz-lib directory. Update this and run yarn install should perform the upgrade.

var data = [
{
type: “indicator”,
mode: “number+delta”,
value: 400,
number: { prefix: “$” },
delta: { position: “top”, reference: 320 },
domain: { x: [0, 1], y: [0, 1] }
}
];

var layout = {
paper_bgcolor: “lightgray”,
width: 600,
height: 200,
margin: { t: 0, b: 0, l: 0, r: 0 }
};

Plotly.newPlot(element, data, layout);

Here’s the screen, there isn’t any error showed in the console. I also attached the code copied from the plotly site.

But if you try this code, the line part work, but the indicator one doesn’t

var data = [
{
type: “indicator”,
mode: “number+delta”,
value: 492,
delta: { reference: 512, valueformat: “.0f” },
ticker: { showticker: true },
vmax: 500,
domain: { y: [0, 1], x: [0.25, 0.75] },
title: { text: “Users online” }
},
{
y: [325, 324, 405, 400, 424, 404, 417, 432, 419, 394, 410, 426, 413, 419, 404, 408, 401, 377, 368, 361, 356, 359, 375, 397, 394, 418, 437, 450, 430, 442, 424, 443, 420, 418, 423, 423, 426, 440, 437, 436, 447, 460, 478, 472, 450, 456, 436, 418, 429, 412, 429, 442, 464, 447, 434, 457, 474, 480, 499, 497, 480, 502, 512, 492]
}
];

var layout = { width: 600, height: 450, xaxis: { range: [0, 62] } };
Plotly.newPlot(element, data, layout);

I have tried to update plotly and the result was still the same.

@jesse Hi, could you help me with this issue please? Thank you :slight_smile:

Thanks for following up. I’m still wondering if you see any errors in your console when the chart doesn’t render.

Hi jesse, there was no error in the console when the chart didn’t render. It seems dash the chart type “indicator” wasn’t support for some reason (even after I updated the library to the newest version).

You can try the second block of code in my previous reply, which is a mix of line chart and indicator. The line was shown properly, whereas “indicator” didn’t render at all.

Would appreciate if you could help look into this issue. Having this type of chart is very useful to me, and I think others too because it shows a very intuitive, compact number to readers.

Thanks

Hi @jesse, have you any update on this issue or any idea how I could fix it please? Thank you very much

Hi @jesse , would really appreciate if you could help with the issue. I have tried several methods (including reinstall redash, upgrade viz-lib to the newest version, try different kind of codes) none worked for the indicator charts. For some reason, it wasn’t support by custom charts although other type of charts worked fine :frowning:

I have reproduced this behaviour, as have a few other posters in the last few years:

Creating map with custom js chart

My only recommendation is to continue debugging, perhaps stepping through the javascript code to see if some exception is not being caught. Since a plot does appear but it’s empty, it’s possible that somewhere along the way the traces passed to the plot are being purged accidentally.

As Redash is a community project, we depend on contributions and assistance from others. I’m happy to answer questions or assist, but someone else will need to take the lead on this one.