hi guys,
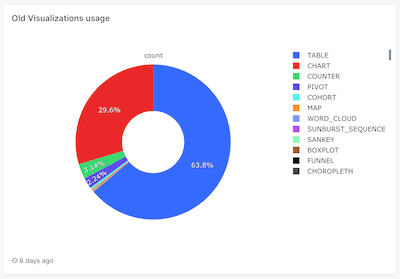
how to change percent Y value to number?
and if data null how to display pie chart?
hi guys,
how to change percent Y value to number?
and if data null how to display pie chart?
I’m not sure I understand your question. Can you share an example of what you want the chart to look like?
This isn’t how plotly works. In all of their examples the percentage is shown. The absolute value is shown on hover: https://plotly.com/javascript/pie-charts/
I think the same is true for Redash.
@k4s1m yes https://plotly.com/javascript/pie-charts/ i wont display 55 not 55% its possible?
Not in Redash. There’s probably a way to make Plotly do this, but it hasn’t been implemented in Redash as far as I can see. It seems quite a bit outside the standard use case of Plotly, also. You could probably implement the feature yourself if absolutely needed. Although I’m not skilled with the visualization code.