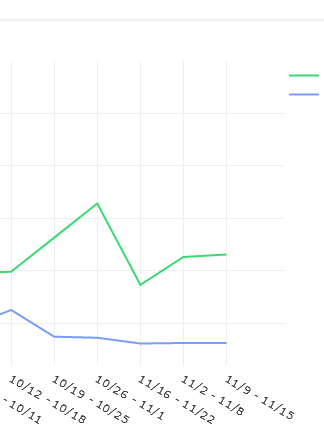
Hi! I’m using the query results data source to get data from google sheets and everything has been working with no problems so far. However, now i added a new row in sheets and the data transferred over to redash nicely, but in the graph that I have set up for the table the added row isn’t shown as the last value. It’s the last value in the table, but not in the graph.