Hi,
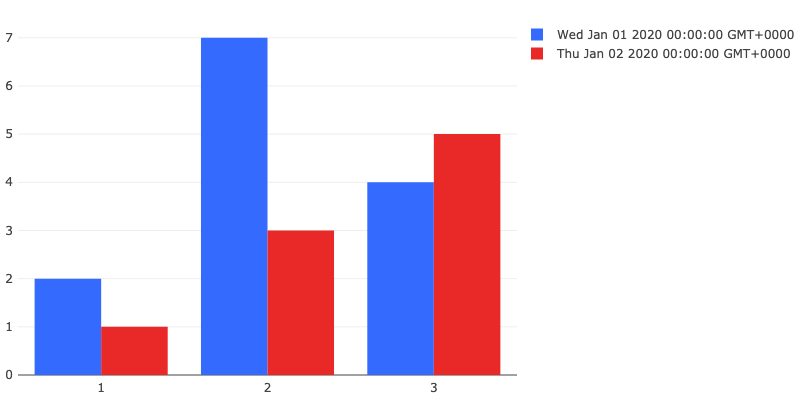
I would like to not display date values as timestamps when using date fields as groups in a plot.
It seems like the graphics engine incorrectly interprets DATE and DATE-like fields as timestamps.
Query to replicate issue.
Note, issue would also occur if d is cast as a string, or if d is simply written as a string of format YYYY-MM-DD.
SELECT CAST(d AS DATE) AS d, x, y
FROM (
    SELECT DATE("2020-01-01") AS d, 1 AS x, 2 AS y UNION ALL
    SELECT DATE("2020-01-01") AS d, 2 AS x, 7 AS y UNION ALL
    SELECT DATE("2020-01-01") AS d, 3 AS x, 4 AS y UNION ALL
    SELECT DATE("2020-01-02") AS d, 1 AS x, 1 AS y UNION ALL
    SELECT DATE("2020-01-02") AS d, 2 AS x, 3 AS y UNION ALL
    SELECT DATE("2020-01-02") AS d, 3 AS x, 5 AS y
)
Graphic illustrating the issue.

