Hi, I have some issues with redash dashboards, I like to show count of values in pie and bars charts but I got the following outputs:
- Also the empty rows doesn’t hide
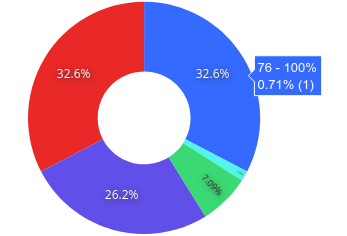
You can see that the percent value in pie are ok, but if you see the labels are wrong showing 0.71% as percent and 1 as count.
The same happen in bar charts the labels show the value of 1 (one record) but not show the count or sum of data:

The data source are google sheets but when I see the date in google the numeric values awas in numberic format.
Thanks for your response.