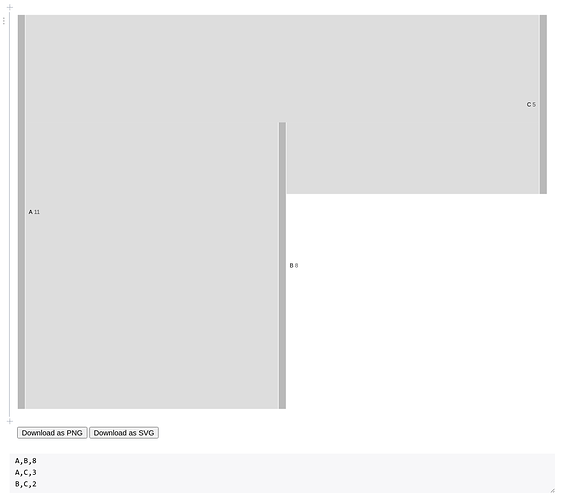
I am trying to visualize the following data flows using a sankey diagram:
A --10–> B --2–> C
A --3–> C
This is quite easy to do using the native d3 format (such as used on the demo site Flow-o-Matic / Mike Bostock / Observable), but how to do this in the more rigid redash e1,e2,e3,e4,e5,value table format?

