How do I change the font size of data in a table display? The data is a number… do i have to send it back to Redash in HTML to get it to be larger?
There’s one example in the demo video of user counts where the number is nice and larger… how do I do that…?
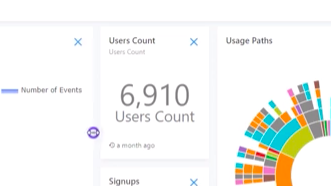
“Counter” is a visualization type used mostly to present single data values in a large fashion. In this demo dashboard there’s a counter - take a look at the query and it’s visualization settings to see how it’s configured.
Thank you so much! I had no idea that was an option. I’m building a dashboard for a public library I work at. Couple of quick questions - I created the counter but can’t make it the same size as the one in the screenshot without text getting shortened… for example it’s showing:
Desktops
(5,343)
When I make it smaller it changes to:
Desk…
(5,343)
Is there anyway to name the visualization without it showing in the widget. In the screenshot it says “users count” three times.
Last question, all my format options are greyed out… how do I get rid of the parentheses in the number formatting?
1 Like
I figured out the sizing issues - I had to first shorten the height and then the width, don’t know why that makes a difference.
how do I get rid of the parentheses in the number formatting?
The number in parentheses is meant to be an indication of what the “target” value is (e.g. an app targets 1000 downloads, a kickstarter project targets 200K$) so the counter allows to see current value vs target value.
If it’s irrelevant to you, simply select “No target value” under “Target Value Column Name” in the visualization settings.
I figured out the sizing issues - I had to first shorten the height and then the width, don’t know why that makes a difference.
The text basically adjusts itself to the container, both height and width.