Issue Summary
Hi, i’m very happy with the data visualization of Redash but I encounter an issue when trying to visualize this table :
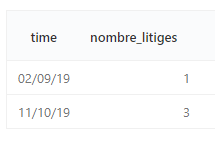
With a bar chart :

As you can see, the bars are veeeeery large, and it’s not easy to understand the chart, I would like a thin bar representing just a day.
Any idea on how to do that ?
Technical details:
- Redash Version: 8.0.0 beta
- Browser/OS: Ubuntu Servio
- How did you install Redash: Docker