Issue Summary
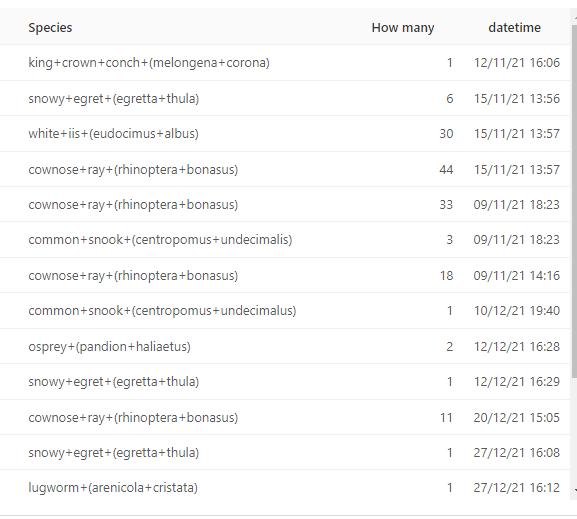
We are having an issue with the heatmap. This is the data in a query, the date format is correct (DD/MM/YY HH:mm)
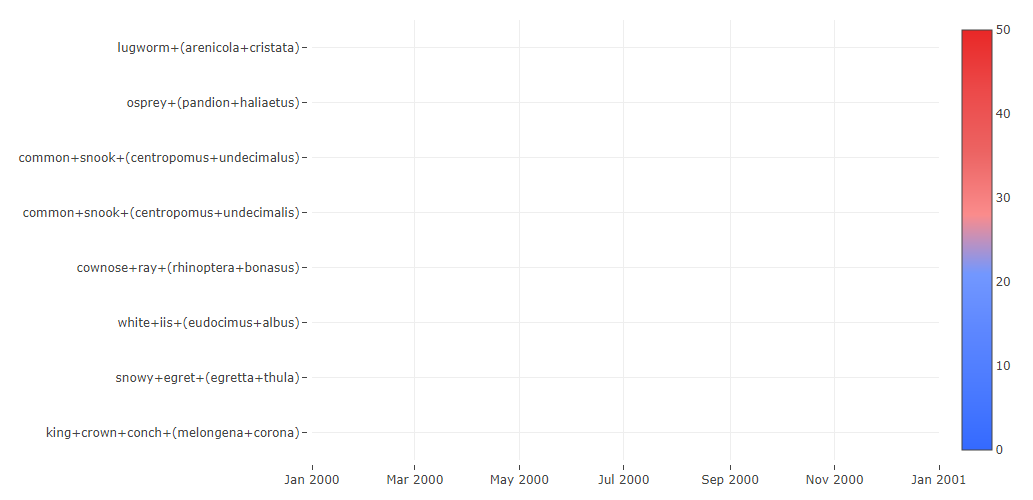
For X Axis we selected “Datetime”
However, the heatmap does not work, it is empty and the dates are also wrong, should be 2021, 2022, but it shows 2000 and 2001.
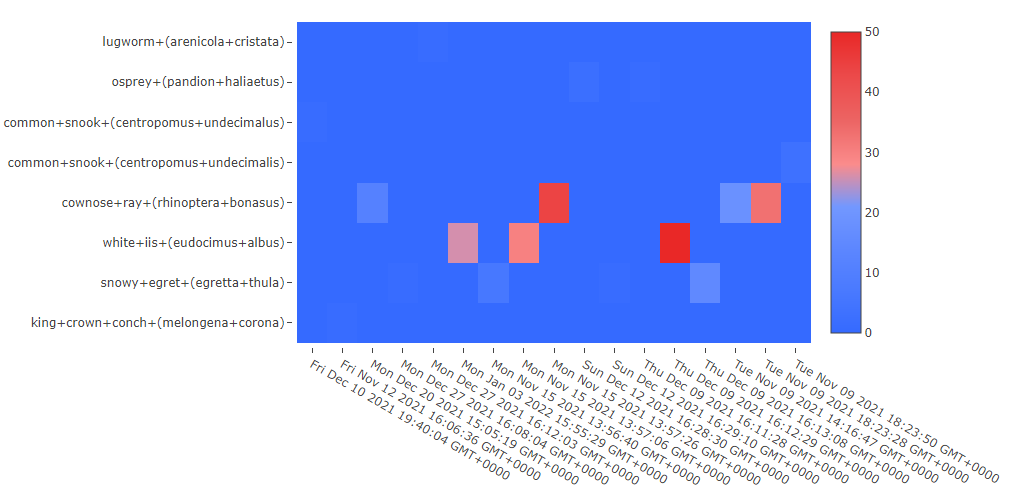
When we change X-Axis to the “Category” the heatmap works, but the dates are out of order (they seem to be sorted alphabetically).
What are we doing wrong, why does the heatmap not show like it supposed to?
EDIT: I just doublechecked date format in settings, it is mm/dd/yy HH:mm
Technical details:
- Redash Version: v.10
- Browser/OS: Chrome
- How did you install Redash:self-hosted AWS
Looks like a bug to me @jesse
As a workaround, consider creating an extra column in your dataset that is a string representation of the date that could be sorted correctly in alphabetical order, e.g., “2022-02-27 15:33”
1 Like
Yeah, but it looks ugly (especially if you have a lot of data points). It would be nice to show dates like it does for line graphs for example, like June 2021, January 2022, etc.
Our current workaround is to use week numbers, but it will only work for one year. and is bad for the user as not everyone knows what week numbers correspond to what months. It would be really nice to resolve this somehow, as it makes the heatmap unusable for anything with many dates that include more than one year.
The heatmap should scale nicely to an X axis with hundreds of entries. Consider X labels like “2022-01”, “2022-02”, … “2022-52” for week numbers. That obviously scales to multiple years.
2 Likes
Great suggestion. It will be our workaround until it gets sorted with dates. Thank you!


