Hello. I have a line with dates on X axis and counts of events on Y axis. How can I add a point on the X axis to see the trend of the line before and after this particular event on the chart?
This site is in read only mode. Please continue to browse, but replying, likes,
and other actions are disabled for now.
Redash will chart the X,Y coordinates that you designate from your query result. It won’t accept arbitrary point definitions unless you include them in your query. I think our charting engine (Plotly) can build trend lines but we haven’t enabled that. You may need to construct a query that performs the trend calculation using a custom query runner like Python or R.
Hi @nikita_okorokov, do you need something like this ![]() ?
?
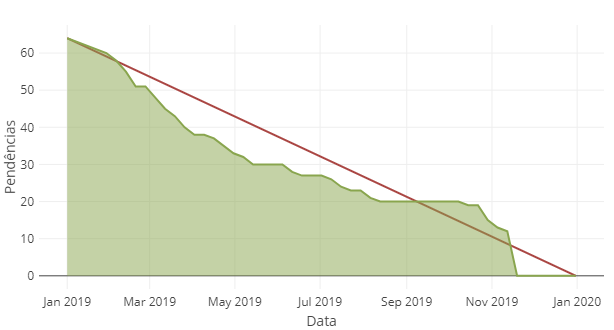
I’ve built this chart with a special SQL query that returns, for each week, two values: one the real value and the other an interpolation (??) estimating the linear decay from Jan 1st to Dec 31st. (sorry for my poor English)
Bye,
Arnaldo
1 Like
Hi @jesse,
I’m sure you will not find it amazing but probably quite ugly 
Here it is:
with ...
, max_value as (
  select count(*) as value from de1
  where ... and ((de1.archive_date is null) or (de1.archive_date >= '2019-01-01'::date))
  and de1.record_date <= ('2019-12-31'::date - (select months_old from p) * INTERVAL '1 month')
), decrement as (
  select count(*) / 52.0 as value from de1
  where ((de1.archive_date is null) or (de1.archive_date >= '2019-01-01'::date))
  and de1.record_date <= ('2019-12-31'::date - (select months_old from p) * INTERVAL '1 month')
)
SELECT week.first_day, week.week_number
, COUNT(CASE WHEN week.first_day <= now() and de.record_date <= p.limit_date - p.months_old * INTERVAL '1 month' THEN TRUE ELSE NULL END) as "Actual"
, greatest(0, max_value.value - (rnum - 1) * decrement.value) as "Estimate"
FROM p, (
  select week_day, row_number() OVER () as week_number from (
    select generate_series(start_date, finish_date, '7 days')::date as week_day from p
  ) as week2
) as week, max_value, decrement, de
where ... and ((de.archive_date is null) or (de.archive_date > week.first_day))
group by week.first_day, week.week_number, p.months_old, max_value.value, decrement.value, p.finish_date, p.limit_date
order by week.first_day desc
Please forgive my SQL. I’ve tried to translate it to English (it’s originally in Portuguese) and strip all the unnecessary SQL stuff (part was replaced by …). Let me explain the main points:
-
I’ve used the WITH clause on the beginning of the query in order to calculate the maximum value and the expected rate (interpolation) of decay (decrement)
-
on the main part of the query, I’ve used generate series to create one row for each week on the year and “row_number() over ()” in order to calculate row number (row index)
Bye!
Arnaldo
1 Like