This site is in read only mode. Please continue to browse, but replying, likes,
and other actions are disabled for now.
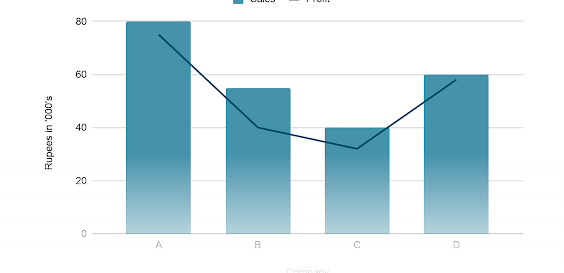
This is already possible with the Chart visualisation. Just use the Series tab of the visualization editor to change how each trace is displayed. For this to work you will need to select multiple Y-columns first. Let me know if you have questions ![]()
HI Thanks For Responding.
When I try with a group by:product_type. In series showing all product_types not y axis.