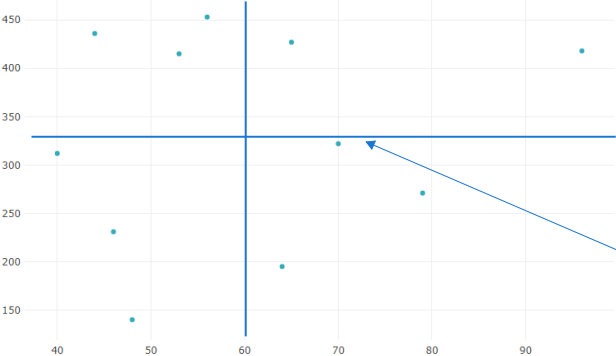
How can I add average line to the chart?
This site is in read only mode. Please continue to browse, but replying, likes,
and other actions are disabled for now.
Redash visualisations don’t calculate anything, so you’ll need to calculate this in your query and plot it like any other line.
