Issue Summary
I am pulling data from Elasticsearch and I need to do 2 aggregations. First aggregation is Day/Month . After Day aggregation, I am aggrgating by category . So for each Day for each category I want the count. Problem is that If I do 2 aggregations, category is splitting to pivot format to columns,. Ideally it shluld come under a field called Count, along with Date and Category.
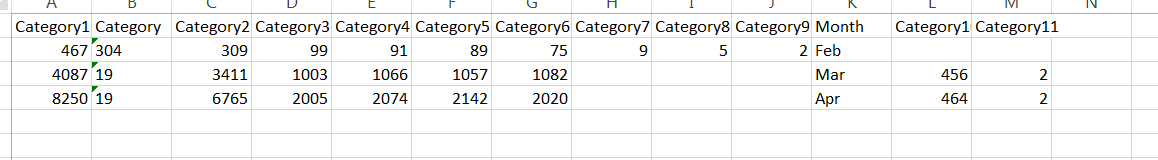
This is the output
Steps to Reproduce
Code is here.
{
“index”: “index1”,
“aggs”: @{
@“Month”: {
“date_histogram”: {
“field”: “date”,
“interval”: “month”,
“format”: “MMM”
},
“aggs”: {
“Category”: {
“terms”: {
“field”: “category”
}
}
}
}
}
}
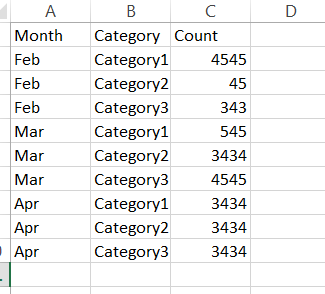
Expected output: