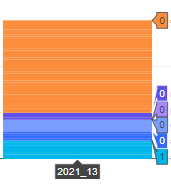
When using a multifilter with stacking enabled the labels seem not to display the sum.
Not sure what the numbers refer to.
The weird thing is the scale on the y axis shows the range from 0-150 as I would expect.
Is there any way to have the sum of each category as labels?
This happens because your query is returning more than one Y-value per group. If you can share a sample of the underlying data I can give you an example that avoids the problem.