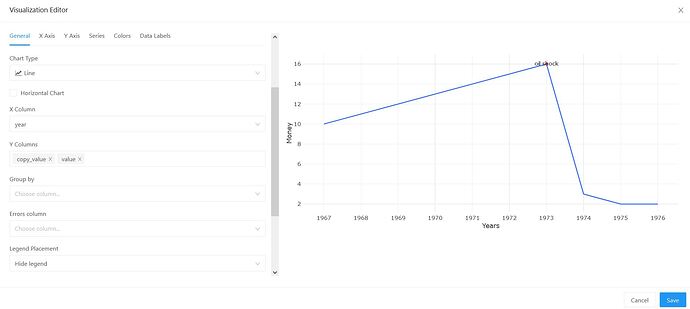
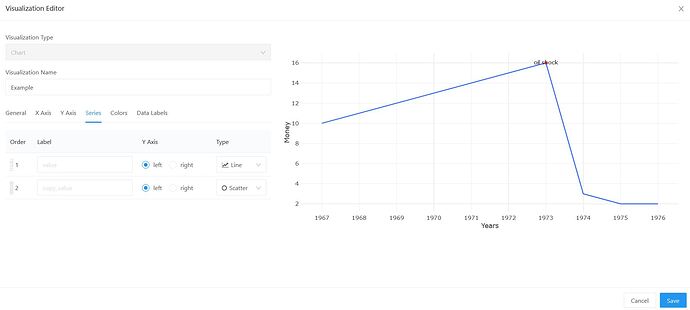
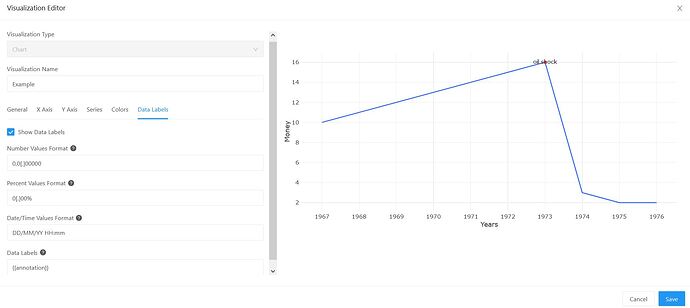
I would like to suggest adding an option to add annotations to charts as a “second layer” of information in order to give users a better understanding of the data.
My use case:
In the company I’m working for, the account managers always keep an eye on a chart which represents the general activity of the clients or something even diving deep and focus on a specific client and they always try to understand the source of each anomaly. currently, their only option is to manually access different data sources (activity logs, billing transactions, and others) which consume too much of their time. combine all the relevant data from multiple data sources and put it on top of the relevant chart will boost their productivity.
Implementation:
I think that this feature should support getting data from multiple sources, such as:
- Queries running on different data sources
- Option to create annotations via Rest API
- Option to manually create annotations by clicking on the relevant in the UI
Related information:
You can take a look at this feature implemented by Grafana:
http://docs.grafana.org/reference/annotations/


