This site is in read only mode. Please continue to browse, but replying, likes,
and other actions are disabled for now.
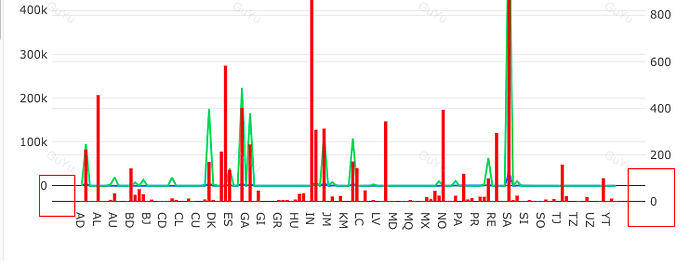
The chart has two Y-axes. You can control this under the visualisation settings. There are independent settings for the left- and right- axes.

