Hello,

How do I prevent a missing value to be displayed in a line chart.
image

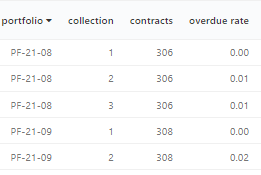
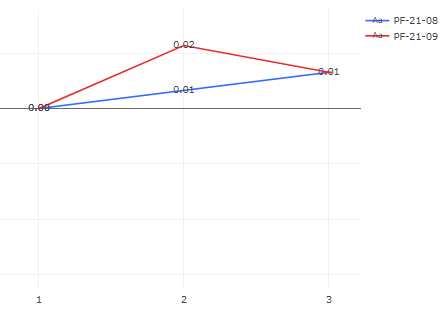
In this Example portfolio PF-21-08 has an overdue rate of 1% at collection 3.
Portfolio PF-21-09 doesn’t have a collection 3 but in the visualization it still shows up on the x axis at value 3.
image

Any help is highly appreciated.

I think something is not right with your data. Because I’m not able to reproduce this. Using your exact data I see this chart:

Can you share your visualisation settings/

Hi Jesse,
thanks for the quick response.
I checked again and I believe the problem was that I had stacking enabled for some reason.

Yes that would do it.