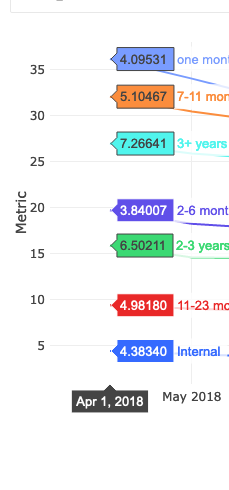
Before the upgrade to v4, I had a visualisation with two Y axes and each scaled independently (the values on the right axist were much smaller than those on the left). After the upgrade, all series scale to the same axis (left axis) and it appears that the Y axis doesn’t actually exist on the chart, as it doesn’t react to scale changes or name changes.
When creating the same visualisation from scratch, the same problem occurs.
Fantastic product, by the way! Very, very happy with this so far.
Andy.
Technical details:
Redash Version: 4.0.0-rc.1+b3791
Browser/OS: Chrome/Firefox Windows 10
How did you install Redash: From AMI on AWS, then upgrade from 2 to 3 then to 4 (beta)
Hi @andyc! I tried to reproduce your issue, and I noticed that we already fixed it (if I understand your problem correctly). Can you please try master and check if your problem still exists or it’s fixed? Thanks!
Thanks levko - I’m not building it myself, but relying on the upgrades, so I’ll hang on until the next beta release. How often does the beta channel upgrade reflect master?