 snrama
1
snrama
1
HI! I am new to redash and querying.
I have a table with the following data
|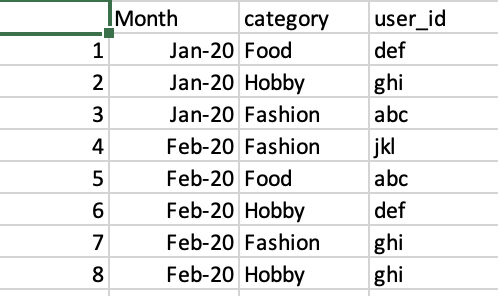
I want to draw a sankey diagram with the user flow. I have checked Flow/Sequence Queries - Sankey and Sunburst Visualizations but wanted a simplified explanation as i got lost. Thanks!
 jesse
2
jesse
2
Can you provide a sketch of how you want your Sankey to appear? I don’t usually see date fields associated with Sankey charts…
A typical result that powers a Sankey diagramt looks like this:
| stage1 |
stage2 |
stage3 |
value |
| a |
b |
c |
1 |
| a |
b |
d |
1 |
| z |
b |
d |
2 |
| z |
x |
c |
1 |
| a |
null |
c |
17 |
Which would make this chart:
You can generate this yourself in Redash using the Query Results data source. Just run the below SQL and add a Sankey visualization:
with base(stage1,stage2,stage3,value) AS (
SELECT * FROM (VALUES
('a', 'b', 'c', 1),
('a', 'b', 'd', 1),
('z', 'b', 'd', 2),
('z', 'x', 'c',1),
('a', null, 'c', 17)))
SELECT * FROM base
