Hello, I am new to ReDash and I need to create a viz with following data (user sessions on the website):
3 columns: user_id, start_at (date-time format), end_at (date-time format)
The viz should include the following:
average (or median) duration of session (actually simple end_at minus start_et)
distribution od session within time of day (morning, noon, evening, etc, can be done with “case when” but how?)
any abnormalities if where are any (e.g. extremely long sessions, night with unsually big number of sessions, etc.)
How to do this using ReDash viz tools? Should I define all the values using SQL-queries or where are any options only within viz app?
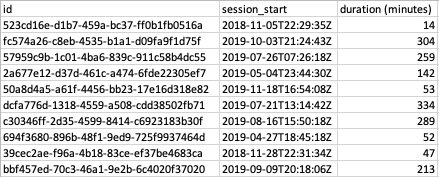
Hi @Alleina and welcome to the forum! The idea with Redash is to use your database to slice and aggregate the data and then visualize the output with Redash. With just two queries you can build a meaningful dashboard from your data set. Here’s a simple example with Postgres and demo data I generated which looks like this:
Base Data
First Query
SELECT
    uid,
    "start",
    "end",
    "duration",
    avg(duration) OVER (ORDER BY (SELECT 1)),
    CASE
        WHEN date_part('hour', start) >   5 AND date_part('hour', start) < 11 THEN 'morning'
        WHEN date_part('hour', start) >=  11 AND date_part('hour', start) <= 13 THEN 'noontime'
        WHEN date_part('hour', start) >   13 OR date_part('hour', start) <= 5 THEN 'evening'
    END "period"
FROM base_data
Scatter plot of session durations by date and time-of-day
SELECT
date_trunc('week', "start") "week",
CASE
WHEN date_part('hour', start) > 5 AND date_part('hour', start) < 11 THEN 'morning'
WHEN date_part('hour', start) >= 11 AND date_part('hour', start) <= 13 THEN 'noontime'
WHEN date_part('hour', start) > 13 OR date_part('hour', start) <= 5 THEN 'evening'
END "period",
avg("duration") "session length"
FROM interpolated
GROUP BY 1,2
Bar chart of average session length by week by time-of-day