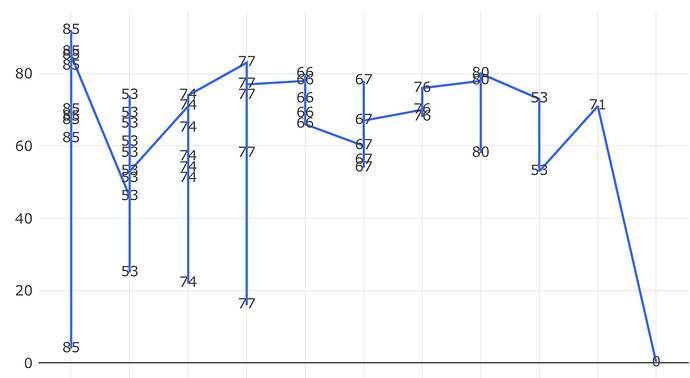
I wrote a simple query to just create a simple line graph, but when I create line graph it shows some unusual behaviour.
I have written this query on in Postgres database.
Please look at this graph and if anyone can help me to figure this out, that would be helpful.

