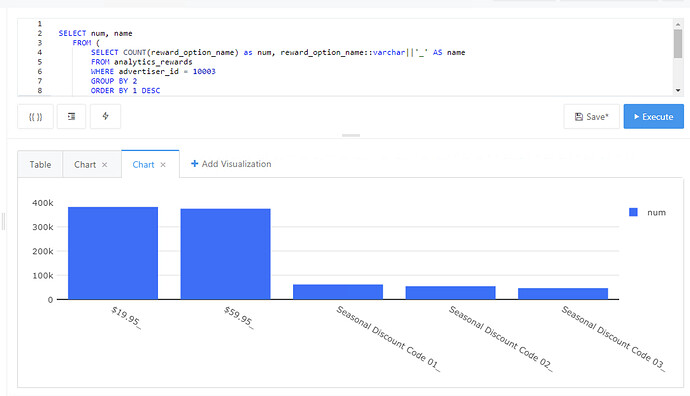
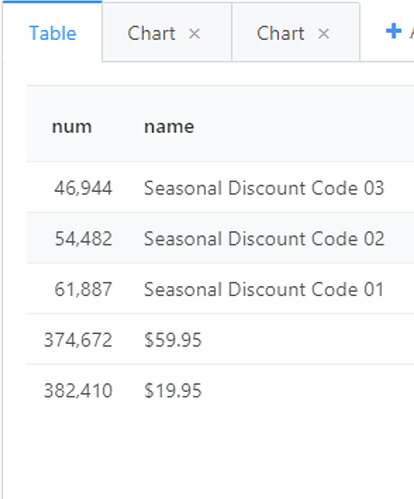
Hi, as you can see below, I am trying to make a standard bar plot of the counts of some items. I cast the names as VARCHARS but the tags with dollar values won’t show up unless I concat some string to the end (this is Redshift). On top of that, if I append an empty string, those bars still don’t show up. Any idea what is going on?
Can you check your table viz and see what datatype redash is picking up by default when you are not appending a string?
I haven’t figure out yet how to explicitly show data types in redash, but it looks like strings…
But then this happens to the chart even though I still cast the column as a VARCHAR:
You can see the data type in the table visualization settings.
Select the Table viz. Click on Edit Visualization. That should show you the individual data types and you can customize your columns and values there itself.
Thanks for the help!! I hadn’t found that yet!
Is there a way to do this through Redash automatically? If I run this same query on other data, it works fine, so I would like to force a data type, even though casting it isn’t working for some reason.
Not sure there. Looks like a quirk of the datasource you are using and how it is implemented in redash. Maybe you should create a github issue if you think it is a bug


