Hi, I would like to visualise sums and counts for various categories in one table.
- Ie putting two pivot tables together like this:
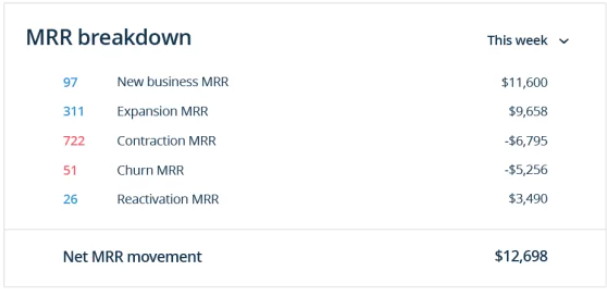
Is it possible?
OR
I was thinking about - using stacked bar chart for sums and then, by data label settings, display ‘count’ value on respective categories, something like this:
Is it possible to set it somehow in data label settings?
Thank you very much for your help,
Best Regards,
Katerina

