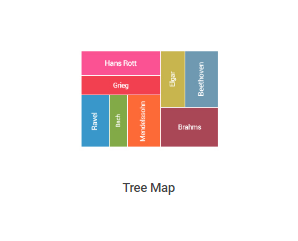
Currently Redash supports several chart types, counter and cohort. What other visualizations you would like Redash to support?
This site is in read only mode. Please continue to browse, but replying, likes,
and other actions are disabled for now.
Ability to select “overall” value in __filter column (i.e. ignore filter and show total values)
5 Likes

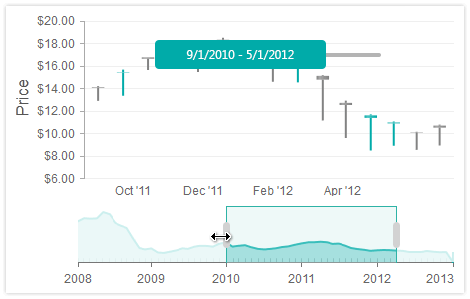
- Table with filtering
- Time navigation with preview (scroller like http://d585tldpucybw.cloudfront.net/sfimages/default-source/productsimages/asp.net-ajax/productitemfeatures/ajax_htmlchart_zoom_and_scroll.png?sfvrsn=3)
2 Likes
Heatmap draw option for the existing map visualization type.
Alternatively (or as well), clustering of points.
This would let you create readable maps with far more points in an area than currently where you’ll get a mass of circles or markers, e.g. http://imgur.com/75KlfVT
4 Likes
Hello, I think it would be interesting to have:
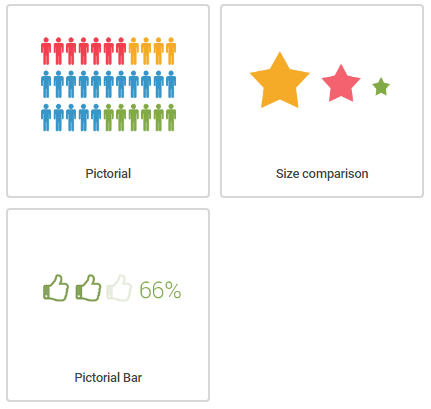
meter (Gauge Chart)
cloud
Trendlines
Thank you
2 Likes


A possibility to add trend lines and moving averages to a (line) chart would be really great to easily make more sense out of pretty noisy data
2 Likes
- Radar chart
- [Calendar] (http://bl.ocks.org/eesur/5fbda7f410d31da35e42) like github
- Some graph or tree
Polygon support in maps.
Ideally this would support WKT so that any type (or collection) of geo data could be returned from a DB in a single column and all mapped automatically.
We have used wellknown.js (https://github.com/mapbox/wellknown) to perform the bridge between WKT from the DB and GeoJSON (for leaflet) in other projects and it’s licensing would allow for it to be used here.
2 Likes
From a quick look, it looks like it should be definitely feasible to integrate this with reasonable effort.
What kind of “systems” give output in wkt?
Awesome 
The proposed use of WKT as the format is simply because we store geographical data in databases (SQL Server & MySQL) in their native spatial types. Both have built in functions to convert these to WKT for output (STAsText, ST_AsText). Other alternate formats (e.g. GeoJSON) don’t have built in functions for export.
I suppose if you wanted to make the maps work with GeoJSON as well (if other databases can output that, or maybe if someone just stored it as a string in their DB) then there could be a drop-down to select from the different supported spatial formats. That way, more formats could be added later if required?
1 Like
Dear, we have the same problems need from a geospatial query that return a geojson draw a maps with the result.