Hi!
I created a query where I display count of statuses grouped by hour.
SELECT date(created), hour(created) as hour, STATUS, COUNT(1)
FROM trades
WHERE created >= now() - INTERVAL 21 hour
GROUP by date(created), hour, status
order by date(created) asc
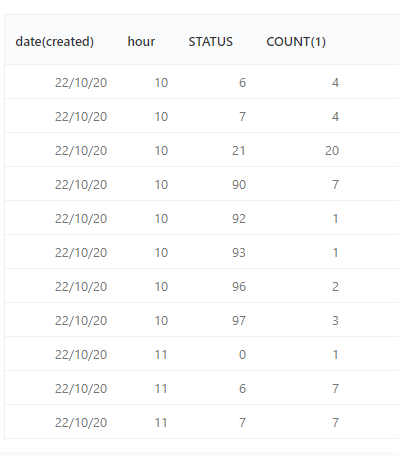
The resulting table is correct:
But the sorting order in the visualization is wrong:
Hello, thanks for your answer. It seems more or less clear how to do you when you have 2 data set (like red and blue), but in my case I may have many different statuses so not sure what to do.
The idea is to write your query so that every combination is listed. I usually do this by UNION with several CTE’s so that every trace has a value supplied for every y axis value.
Login or sign up disabled while the site is in read only mode