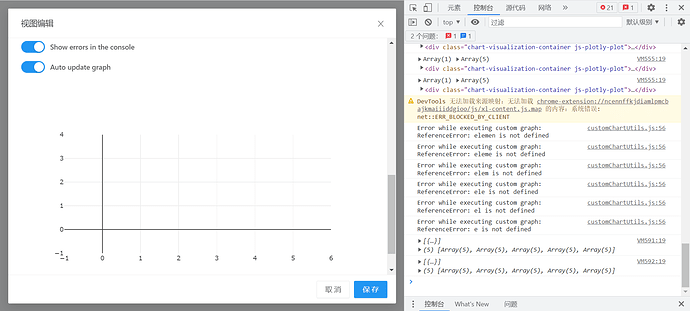
other charts are ok,such as bar,scatter etc.but table looks like special.When I try to copy codes from plotly examples,it becomes weird.
By the way,i don’t use redash’s table,because i can’t change the table to take up just one column in dashboard.For me,it’s too wide.And also i can’t change the default column number of grid.Sad,it stops.relevant post

