Let’s take a deep dive into the Alerts feature in Redash and discuss improvements and ROI.
Alerts list:
An overview of alerts with sorting ability and trigger state.
Let’s take a deep dive into the Alerts feature in Redash and discuss improvements and ROI.
An overview of alerts with sorting ability and trigger state.
Here are a few points to discuss with my suggestions:
All points look valid 
I’m wondering if the word “State” in “State Updated At” makes sense to non-techies. WDYT?
Disregard that - I thought you are implying that this value will show the last time the query was updated. Together with the “State” column it makes sense.
Here’s the redesign.
Alert status indication, am I right?
Requested in Link to Query from Alert.
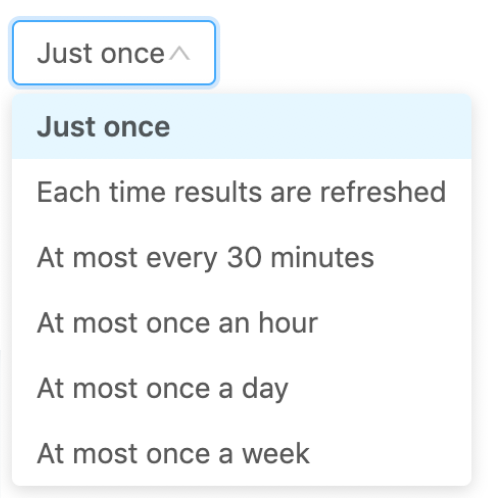
Important to show how often a query auto-refreshes. If it doesn’t, we notify:
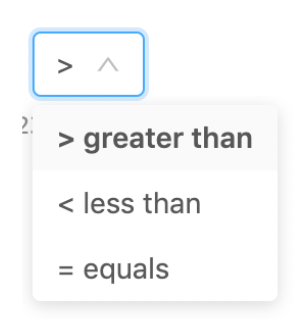
More concise and clear. Condition options:
Alternative to “rearm seconds” with options:
Help trigger.
Link to Alert Destination page (with clear tooltip).
All destinations appear toggled off by default.
Click destination to config it:
![]()
Wait, where’d Alert name input field go? The title is editable like in query and dashboard.
This layout has also taken into consideration future features based on requests. More on that later.
I have to admit that even today I find it confusing when I want to create a new alert.
 I guess not. Although N/A can happen in future runs as well.
An alert might seem no longer relevant if it was created 2 years ago, but if it was updated 10 days ago it’s a whole different story. I wonder if updated at is more important than created at?
It has its own column so we can sort by it? Because otherwise I think it makes sense to merge it with the state column.
There is no archive for alerts.
I would consider adding in the filters filter by state (to see all triggered for example).
Maybe we just open the Schedule Dialog here?
Should we clarify that this is only when the alert is triggered? I’m not sure it’s clear this way.
While this UX looks good, I’m not sure how it scales when there are many alert destinations. On the hosted Redash we have an account with 45 alert destinations (35 webhooks, 10 emails). I won’t be surprised if some self hosted instances have even more.
While it’s consistent with the other pages, it doesn’t look clickable much  (we might have the same problem on dashboards/queries, but we are just used to it). Not sure this is a pattern we need to keep. Or atleast we need to have some visual cue that this is the case when in edit mode.
Last Updated At: An alert might seem no longer relevant if it was created 2 years ago, but if it was updated 10 days ago it’s a whole different story. I wonder if updated at is more important than created at?
My feeling is that relevancy is better determined by “last triggered” (if it never triggers then it has no value) and in the near future by “enabled” state. Created and Updated I think are not indicative.
State Updated at: It has its own column so we can sort by it? Because otherwise I think it makes sense to merge it with the state column.
Yes for sorting. Don’t have data to determine if it’s valuable or not. Can leave as is for now.
I would consider adding in the filters filter by state (to see all triggered for example).
Maybe we just open the Schedule Dialog here?
Right right
we have an account with 45 alert destinations (35 webhooks, 10 emails)
Not sure this is a pattern we need to keep. Or atleast we need to have some visual cue that this is the case when in edit mode.
My thoughts exactly (I was very careful to keep the look/feel and conventions of the current design). I’ll try to make it clearer that it’s editable.
One more thing I realized: it makes sense to have an alert page that isn’t editable and an edit view (which is what you have here). Wdyt?
One more thing I realized: it makes sense to have an alert page that isn’t editable and an edit view (which is what you have here). Wdyt?
Makes so much sense
Having everything disabled is no way to treat a visitor.
@arikfr the Alert page design is based on our current content and implementation, but there are 2 feature options that can change this design dramatically, as they turn into more of an incident analysis page.
Show alert history - in vertical log format or timeline graph.
Show visualization with clear threshold marking.
Wdyt of these?
I don’t think it should turn into incident analysis page. This feature will probably be renamed to better describe its intention, maybe something like “Triggers” or “Workflows”.
We might still decide to show history but it will be a more elaborate one than just showing time and status. But regardless it’s out of scope.
Even-though some comparison conditions (==, !=) work for strings, they can’t be used cause the ui constrains the threshold value in a number only input.
One approach would be to substitute the input with type="text" and show an “invalid value type” error only when:
= or !=.Here’s how it looks:
Number column value, number operator, number threshold value
String column value, string operator
String column value, number operator - mismatch
Number operator, string threshold value - mismatch
@arikfr @levko U can play with it here https://deploy-preview-4081–redash-preview.netlify.com/alerts/11
Having the “Delete” button in such proximity to the “Save” button makes no sense.
Especially knowing that “disable/enable” is an upcoming feature, better have a dedicated place for such dangersome actions.
Here’s a suggestion:
@arikfr wdyt?
UI design for the two alert modes - view and edit.
About the error messages when there is a mismatch between threshold, value or operator: I would go for clearer error messages –
The location makes sense. But not sure about placing “disable alert” under “Danger Zone”, as it’s not that dangerous  Maybe we can drop the Danger Zone title?


